A dry weather pattern has dominated California since the start of January, and the grim results are illustrated in this week's U.S. Drought Monitor report.
The drought map released Thursday shows the dry spell is taking a toll on a widespread part of the state during what is historically the wettest time of the year. The impact is striking in Central California, which has abruptly entered moderate drought -- the second-most severe of five drought intensity levels listed in the weekly report.
"January and February have been abysmal," said NBC4 forecaster Anthony Yanez. "These are the two wettest months, and it's really taking a toll."
The monitor's categories range from abnormally dry to the most severe exceptional drought.
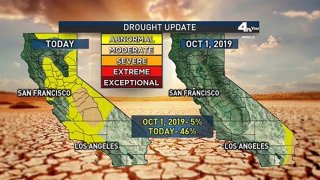
Nearly 10 percent of California falls into the moderate drought category. At the start of the water year, only a sliver of the extreme southeast was in moderate drought. Last week, no part of California reached that level.
Forty-six percent of California -- including Los Angeles, Ventura and Santa Barbara counties -- is considered abnormally dry. That's up about 12 percentage points from the Feb. 2 drought report.
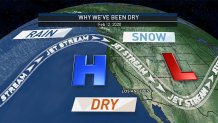
One main reason: High pressure is blocking rain from moving into our area and steering it toward the Pacific Northwest. The systems that would otherwise bring rain and snow are pushed too far north, which is especially bad news for the state's vital Sierra Nevada snowpack.
"Honestly, I don't see any kind of major changes in this pattern for the next week, maybe the next two weeks," Yanez said.
Ideally, a conveyor belt of storms blankets the mountain range with snow that melts in warmer months, providing water that enters the state's aqueducts. The snowpack accounts for about 30 percent of California's water supply.
The snowpack was showed promising signs after storms in November and December, but the amount of water contained in the snowpack is now only at 59 percent of average.
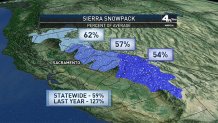
Last year, the statewide average was 127 percent of average. By the time the final snowpack survey of 2019 was taken, it was nearly double its average for early May after a series of winter storms pounded the West Coast.
Snowpack typically peaks around the time of the April 1 survey, so there's still time for conditions to improve before the hot and dry summer months.
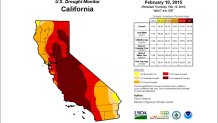
And, California has seen much worse during its history of prolonged dry spells followed drought busting wet winters. Consider February 2015, when more than 41 percent of California was in the most severe drought category. At that time, nearly all of the state was in moderate drought or worse.
That was just part of a years-long drought that was finally washed away by a series of powerful winter storms in 2017.