County Map Showing Neighborhood Case Rates Paints Grim Picture
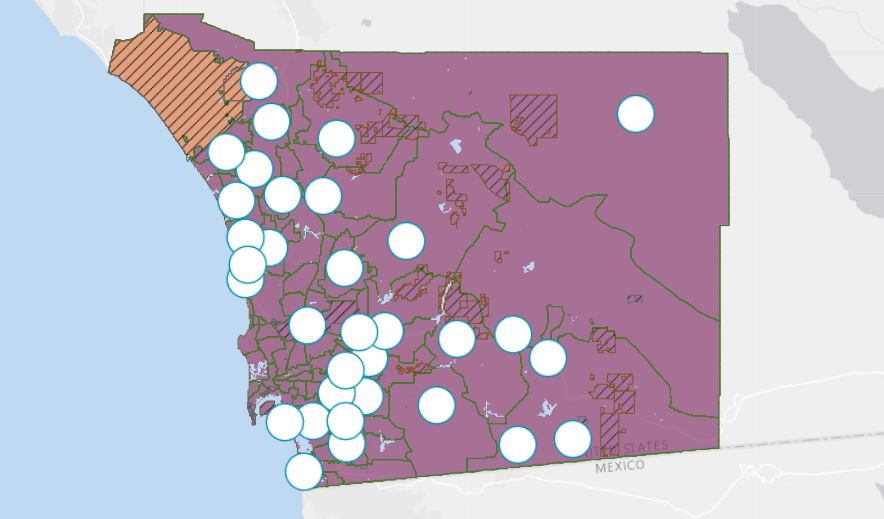
Data published by San Diego County every Thursday showing coronavirus case rates in individual cities and ZIP codes paints a detailed picture of which communities are being hit the hardest. The interactive dashboard color codes neighborhoods and municipalities in accordance with the state’s four-tier reopening blueprint. Click here to see the county’s dashboard. San Diego County’s demotion into the most…